FTF Flagship Strategy
Our flagship strategy employs similar underlying investment principles of value investing to capitalize on P/E arbitrage opportunities, enhanced with equity options to amplify the Sharpe ratio.
Key Metrics
Type
Aggressive
Size (USD)
0.0 B - 0.0 B
Target Annual Return
0.00%
Historical Annualized Return
> 0.00%
Annualized HSI Outperformance
> 0.00%
Maximum Drawdown
< 0.00%
Holding Period (months)
0 - 0
Review Period
Monthly
Asset Selection Criteria
- 1
Verified Growth and Sector Sustainability
The equity selected must demonstrate consistent revenue and earnings growth within a resilient and expanding industry or sector. This includes evidence of long-term demand drivers, regulatory stability, and competitive positioning that supports sustainable performance.
- 2
Clear Business Model
Companies must exhibit a well-defined and executable business model with a visible trajectory toward profitability. This includes positive unit economics, scalable operations, and strategic initiatives that support margin expansion and cost efficiency.
- 3
Strong Management Team
Leadership must have a proven track record of execution, innovation, and governance. Preference is given to teams with prior success in scaling businesses, navigating market cycles, and delivering shareholder value.
- 4
Exceptional Valuation Opportunity
The equity must be priced at a compelling value relative to its intrinsic worth, based on metrics such as future P/E and current PE, EV/EBITDA, and discounted cash flow analysis. The strategy targets valuation inefficiencies that offer asymmetric risk-reward profiles.
- 5
Established Institutional Investment Presence
The company should ideally have ongoing institutional investors or recent shareholding addition from reputable institutional investors. This signals confidence in the business model and provides liquidity for exit in the future.
Execution Process
AI-Enhanced Market Intelligence
Our proprietary technology platform processes all stocks from global exchanges to identify market trends and emerging opportunities.
Traditional Fundamental Analysis
Experienced investment team conducts rigorous company analysis, including financial assessment, industry research, management evaluation, and competitive positioning using proven methodologies.
AI-Assisted Valuation & Expert Review
Our algorithm analyzes P/E inefficiencies and market anomalies, integrating sentiment indicators and historical patterns to identify optimal entry points, which are then validated by our investment committee.
Portfolio Optimization & Risk Management
AI-assisted optimization integrated with traditional portfolio theory creates diversified portfolios to maximize returns or minimize risks depending on client's risk preference.
Continued Monitoring & Dynamic Adjustment
Integrated monitoring system provides real-time market surveillance while the investment team conducts regular portfolio reviews and tactical adjustments based on market conditions.
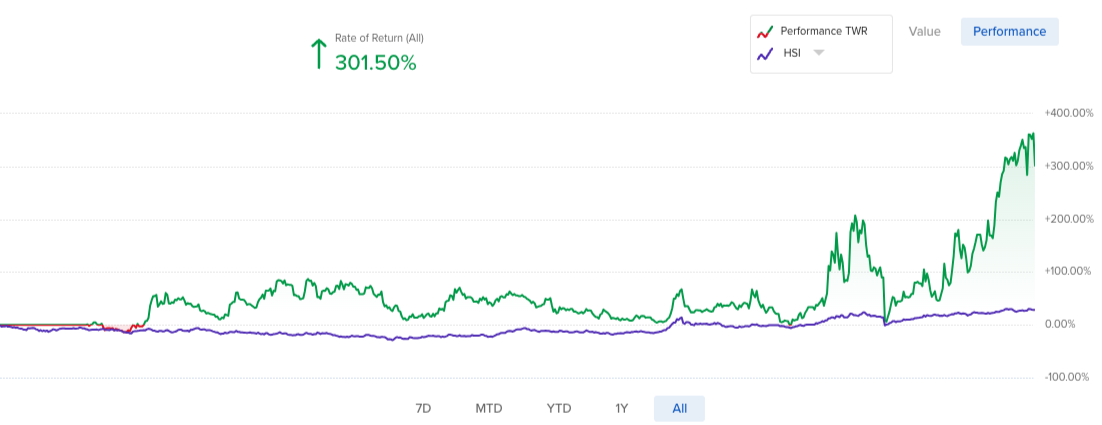
Performance
Period
0/0/0 - 0/0/0
Months
0
Cumulative Return
0.00%
Annualized Return
0.00%
Annualized HSI Outperformance
0.00%
Maximum Drawdown
0.00%
| Year | Jan | Feb | Mar | Apr | May | Jun | Jul | Aug | Sep | Oct | Nov | Dec | YTD | HSI YTD | Alpha |
|---|---|---|---|---|---|---|---|---|---|---|---|---|---|---|---|
| 2025 | 10.50% | 35.53% | 6.89% | -18.03% | 19.21% | 43.37% | 57.13% | 352.40% | 24.18% | 328.22% | |||||
| 2024 | -34.74% | 9.92% | 25.11% | -0.28% | -11.00% | -3.87% | -4.50% | -6.12% | 28.38% | -15.93% | 10.22% | -12.88% | -28.83% | 17.70% | -46.53% |
| 2023 | 4.64% | -14.34% | 60.65% | -4.16% | 6.34% | 14.80% | -9.57% | 9.51% | 4.23% | 69.84% | -13.80% | 83.64% |
Historical records do not represent and guarantee future performances. Decision-making must be discrete as investment carries risk.